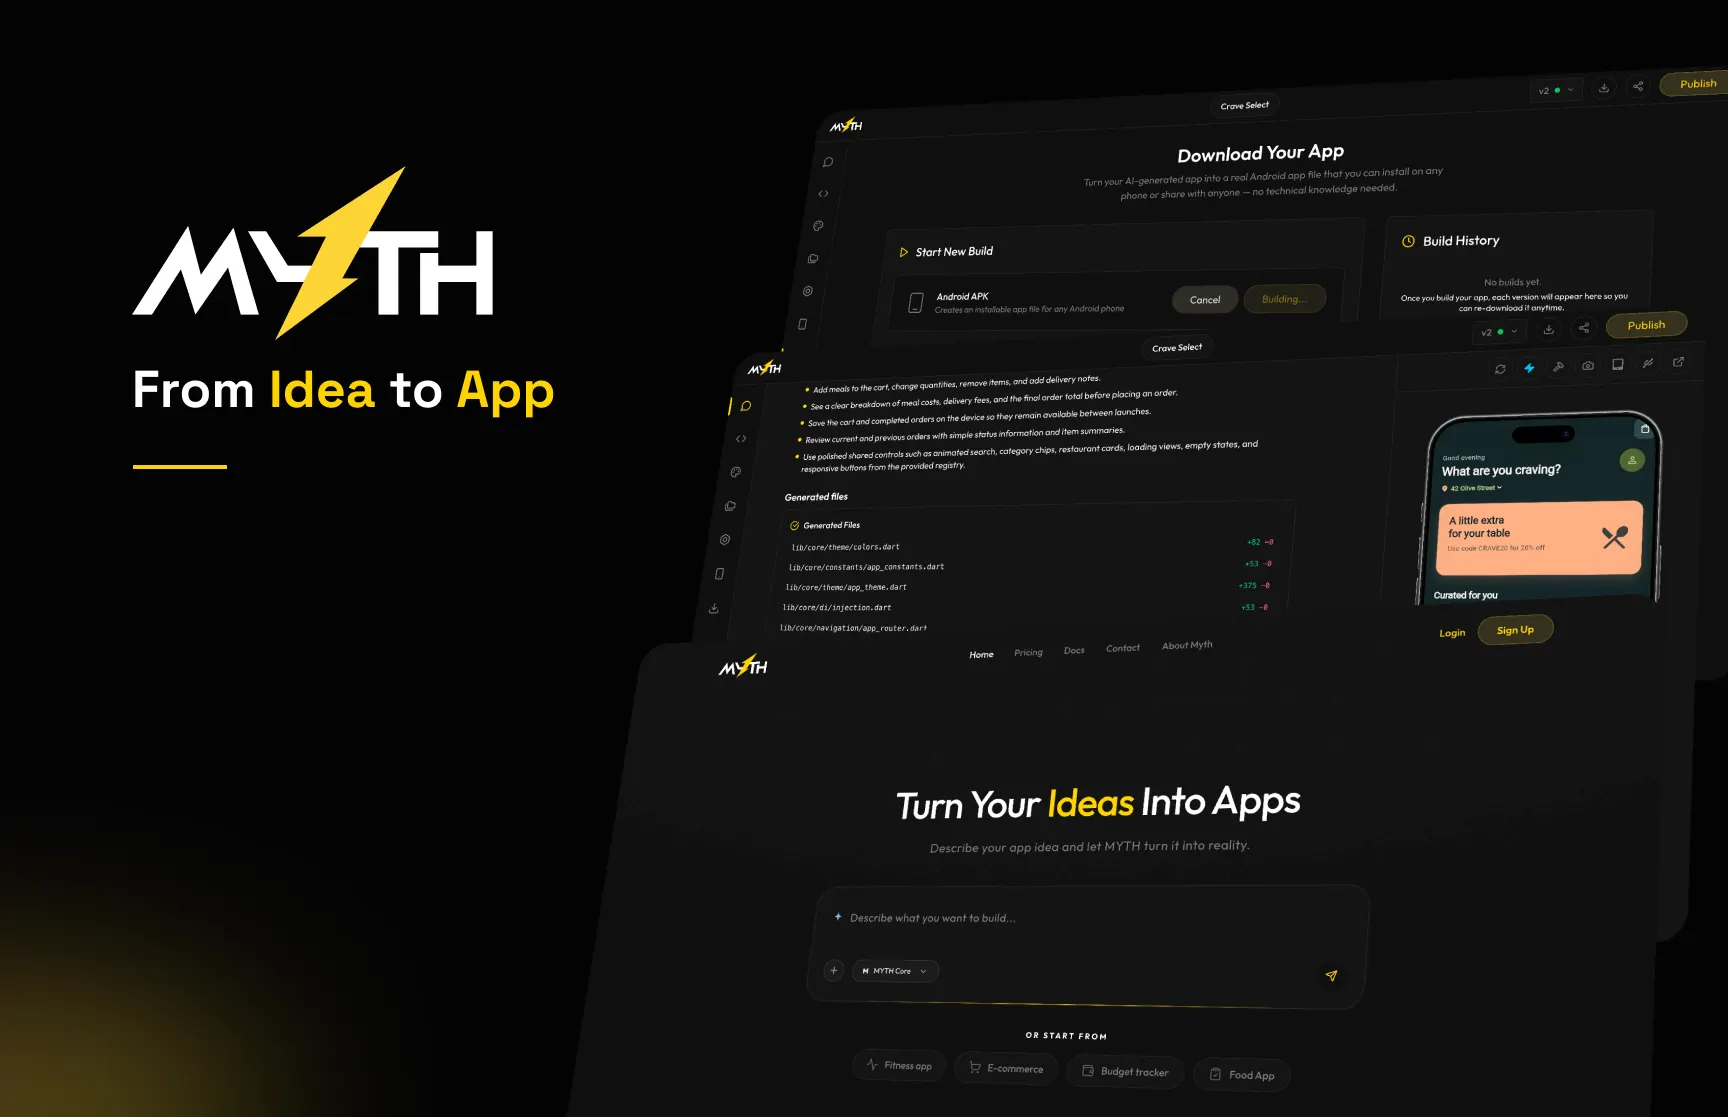
AI mobile app generation
An AI platform that turns a plain English description into a real mobile app you can install on your phone.
An app that helps Pakistani stock investors track what they own, what it is worth and how it is doing.
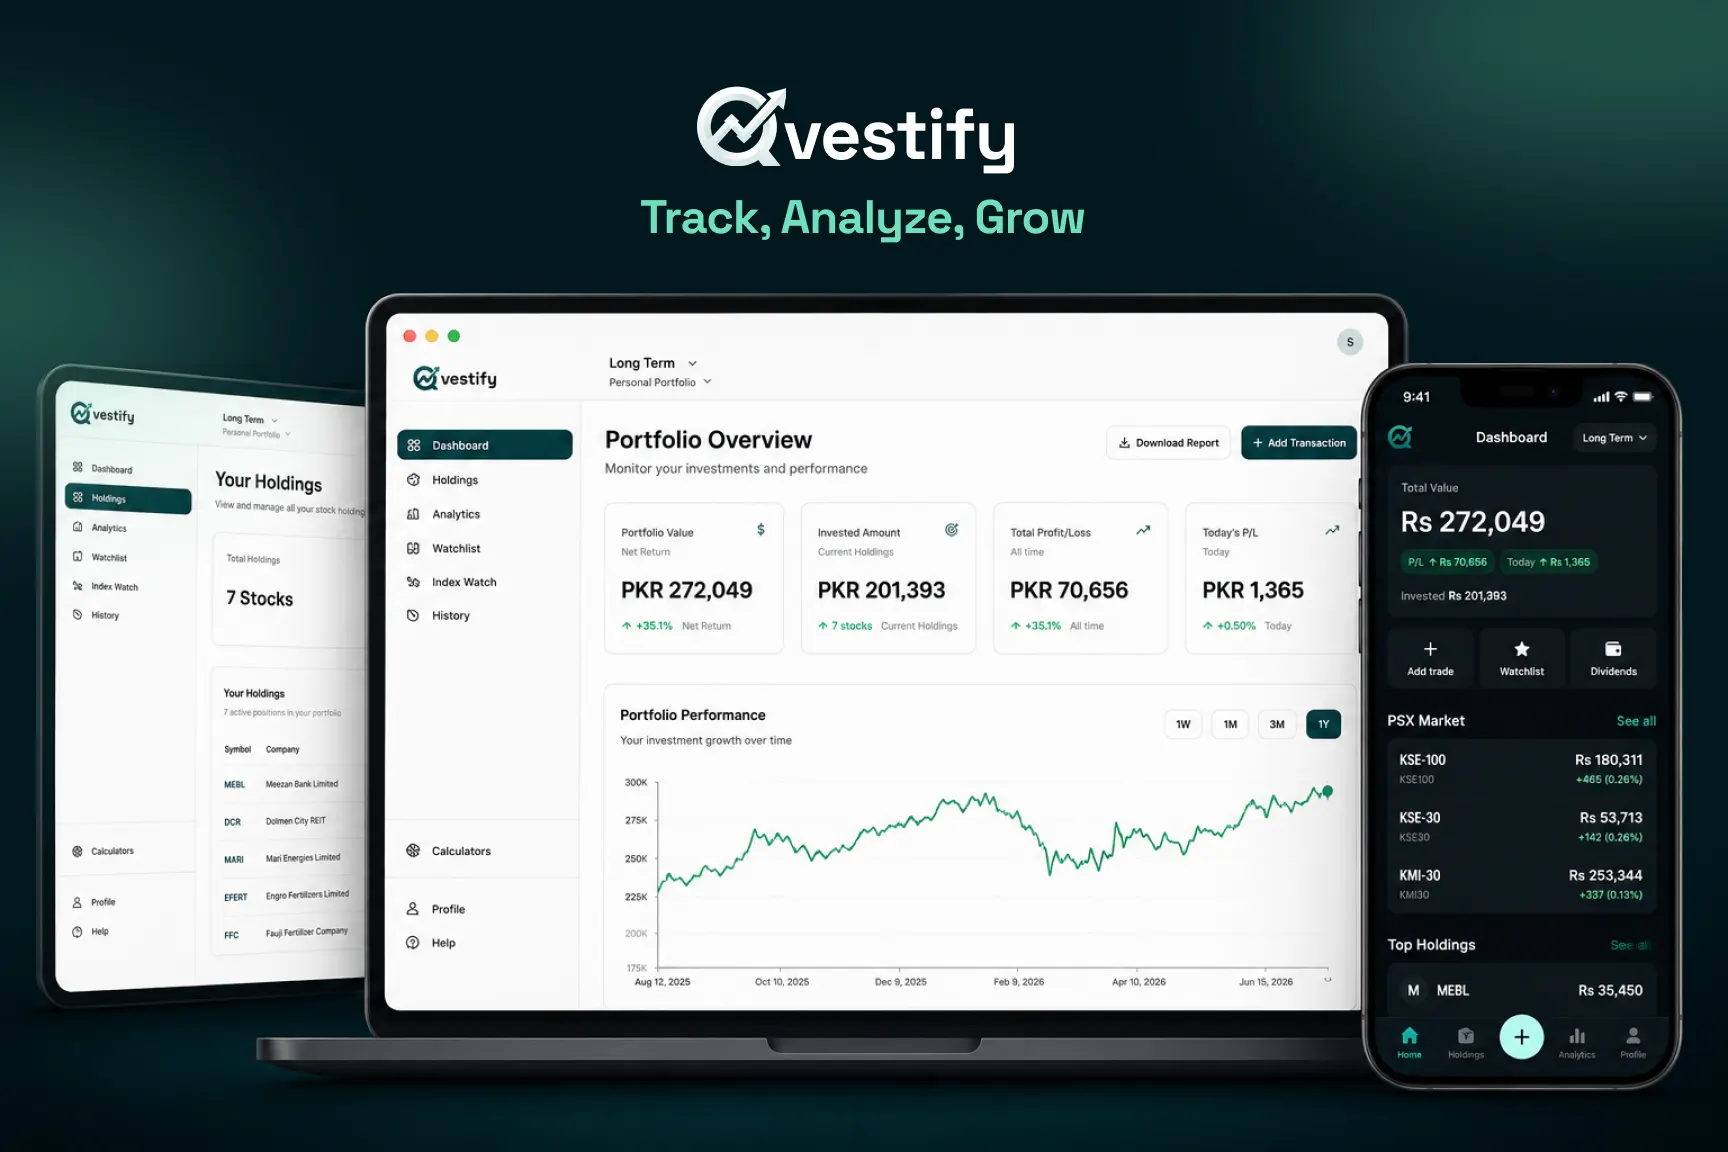
Investors in Pakistan had no proper tool for keeping track of their shares. The choices were a spreadsheet, an old brokerage portal, or an expensive platform built for banks and funds rather than for one person. Qvestify was built to fill that gap: a clean, focused way to see what you own and how it is actually doing, made specifically for the Pakistan Stock Exchange.
The idea is simple. You record every share purchase, sale and dividend you receive. Qvestify then prices all of it against the live market and shows you what it is worth today, how much you put in, what you have made or lost overall, and what changed just today. A chart tracks the portfolio over any period from one day to a year, a donut chart shows how much is sitting in each industry, and a table lists every holding with its average buy price, current price, market value and return.
Beyond that there is a watchlist for shares you do not own yet but want to follow, a page tracking the main market indexes side by side, and a dividends view showing what you have received and what that works out to as a yield. The analytics section goes deeper: returns broken down by period, monthly bars, daily profit charts, and a risk view flagging when too much money is concentrated in one industry or one company. You can hold several portfolios at once, each with its own type, risk level and time horizon, and switch between them.
Qvestify runs as a responsive website and as a native phone app for Android and iPhone. Both talk to the same interface and the same database, so a feature is built once and appears in both. The phone app has its own design system built first, shared colour, type, spacing, corner and shadow scales, then 24 reusable components on top including proper loading placeholders, which is what keeps 20 plus screens looking like one app rather than twenty.
The business side is a three tier model: a free plan, and two paid plans that raise the portfolio limit, unlock the full analytics and allow downloadable reports. Paddle handles the checkout and the subscription messages that follow, and the plan limits are defined once in a typed file that drives both the server side checks and the upgrade prompts users see, so the rules cannot disagree with each other. Portfolio reports are produced as branded PDFs entirely inside the browser, capturing the live chart as an image and building the holdings table underneath it, which means there is no report server to run or pay for. Holdings can also be exported as an image to share.
There are also public calculators for regular monthly investing, one off investing and working backwards from a savings goal, which need no account and exist to bring in search traffic. Behind the scenes, PostHog tracks a dozen events with signup and activation funnels, and an admin panel covers users, feedback, subscriptions and growth charts. Qvestify is live and used by more than 1,000 investors.
The exchange serves live intraday prices and end of day prices through separate feeds, and neither one alone can answer what a share is worth right now.
Built one price layer that reads intraday quotes while the market is open, falls back to the latest stored close when it is not, caches current prices in memory for 60 seconds, and writes end of day rows to the database in bulk batches of 500 with a daily dedupe.
The website and the phone app had to stay in step without maintaining two backends.
Pointed the Flutter app at the same Next.js routes and MongoDB database the website uses, with tokens kept in secure storage on the device. New features land once and both clients pick them up.
Plan limits had to hold even if someone called the interface directly, while still showing helpful upgrade prompts in the app.
Defined the plans in one typed place and derived the entitlement checks from it, so the same rules drive the server side guards and the locked content components that explain which plan unlocks a feature.
Portfolio reports needed charts and tables inside a PDF, without running a report service on the server.
Generated the whole report in the browser, capturing the live chart with html-to-image and building the holdings table with jsPDF autoTable, so there is no server rendering step to maintain or pay for.
The phone app grew past 20 screens and started to look inconsistent.
Built a design system first, with shared colour, typography, spacing, radius and shadow scales, then 24 reusable widgets including skeleton loading states, so every new screen inherits the same look and dark mode works everywhere.
AI mobile app generation
An AI platform that turns a plain English description into a real mobile app you can install on your phone.
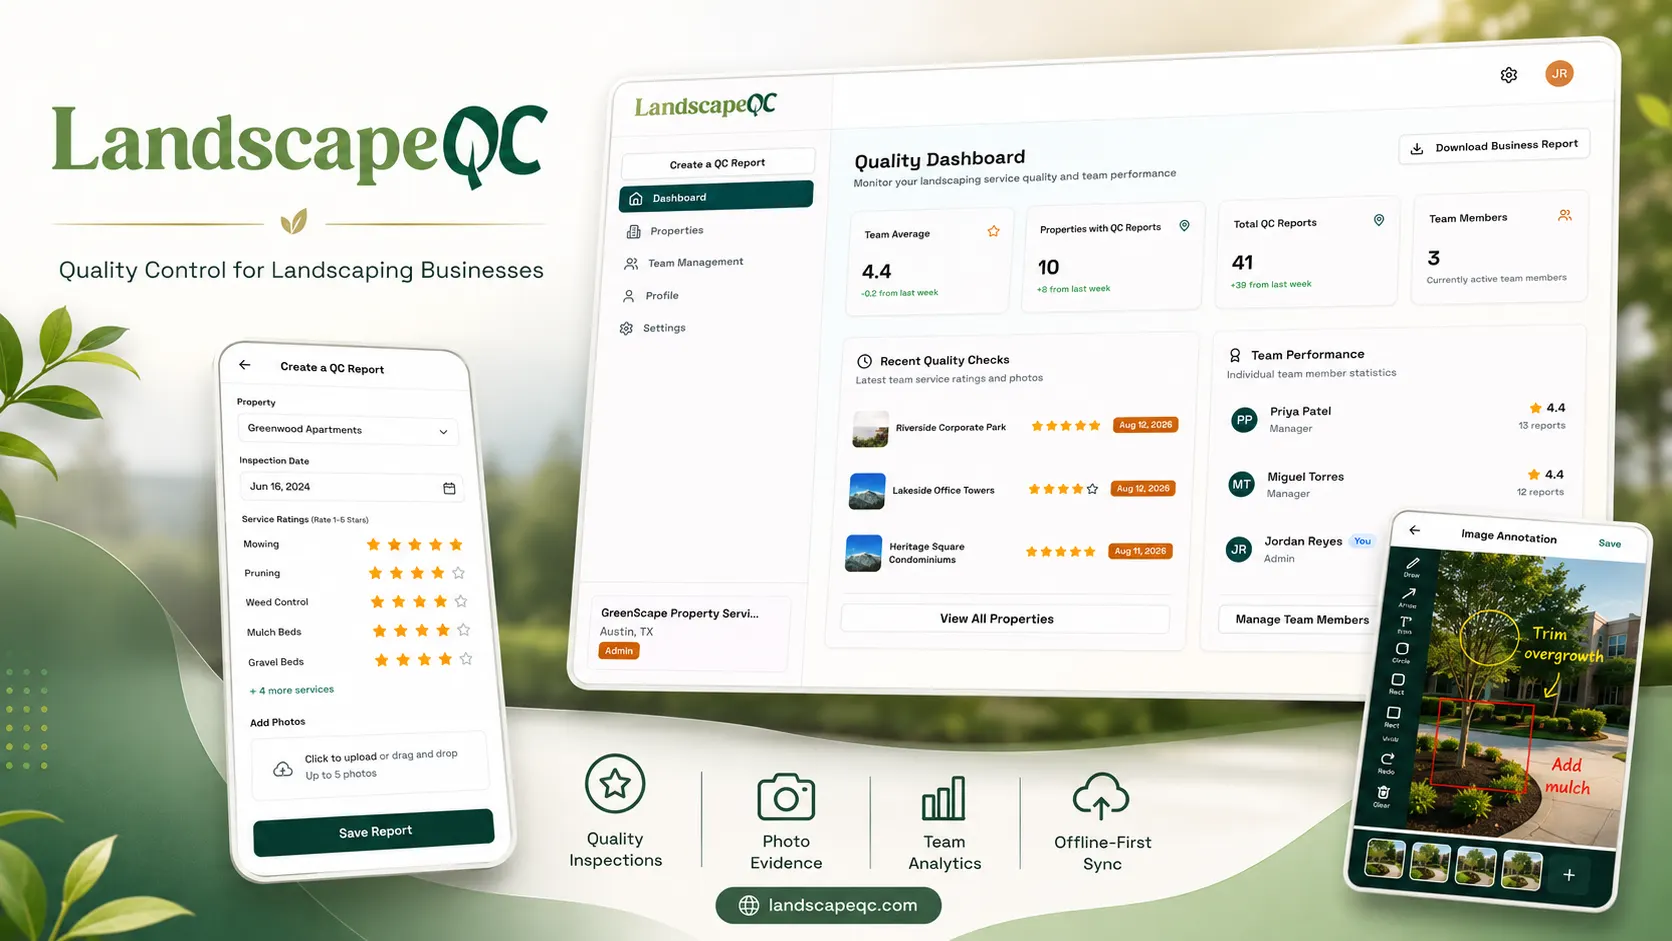
Field quality assurance
A tool for landscaping companies to check the quality of their work on site and prove it with photos.
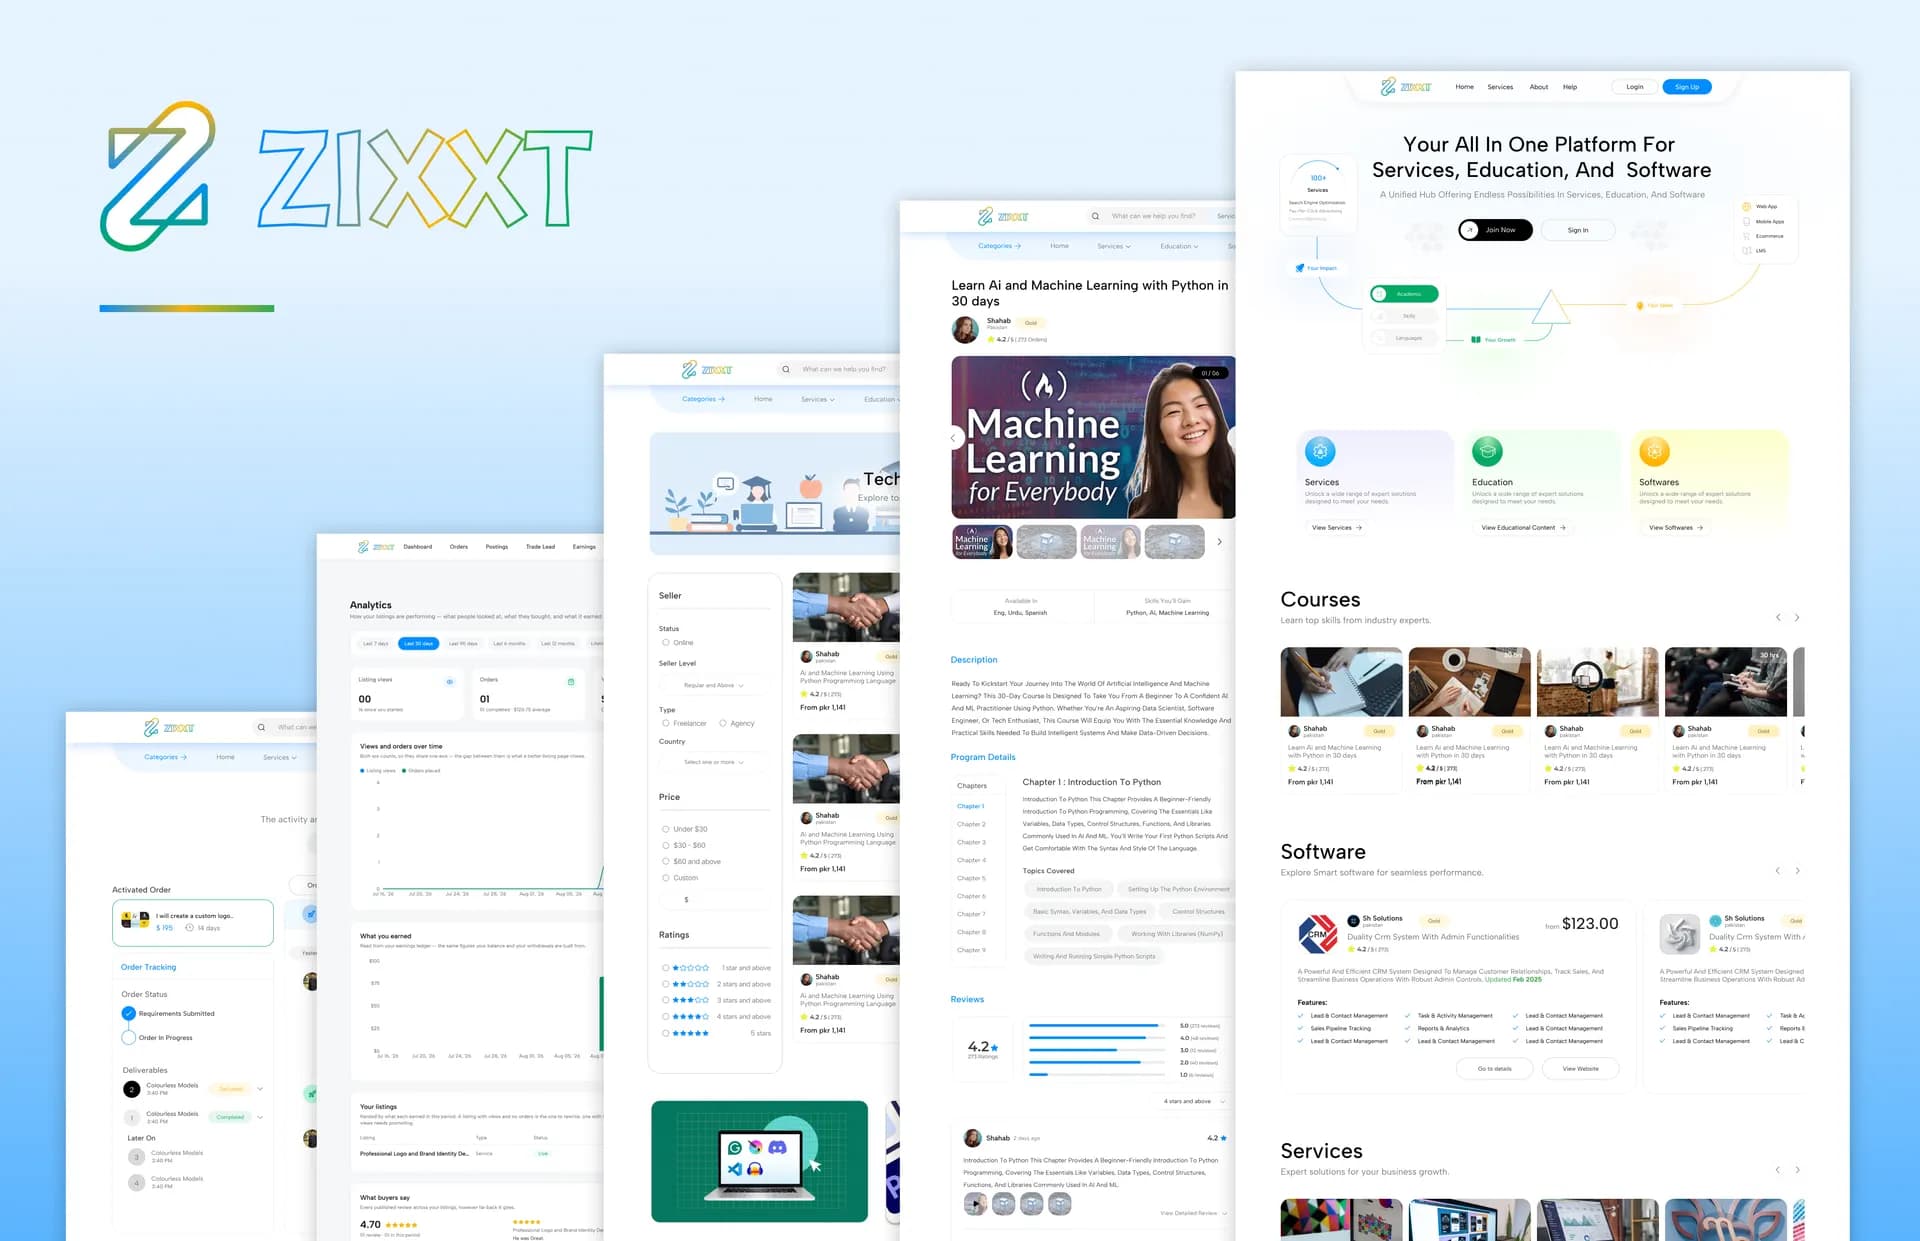
Three markets, one platform
One marketplace running three separate markets: hiring freelancers, buying courses, and finding software.